
Passing TD% Regression Candidates
By Ben Rolfe
Touchdowns. There is nothing much more important in the game of football than touchdowns. Quarterback’s careers are made and destroyed largely on their ability to do just that. Naturally, there is more to it than just touchdowns, but ultimately touchdowns win football games. The number of touchdowns a player scores is always a headline grabber. However, what is perhaps more important to put it in context is their TD%. TD% puts that overall number into context based on how often that QB threw the ball. Maybe they only threw for 15 touchdowns because their offense committed to running the ball? Perhaps 40 touchdowns mean a little less because all the team did was throw the ball?
In this article, I am going to look at passing TD% numbers from last season, and identify which players are potentially due to regress, based on historical comparisons, in 2019.
What is regression?
Player performance rises and falls, and with it so do their numbers. Some players are less prone to this because of their playing style, but others can have wild swings from year to year. Those are the players we are looking to identify as we enter 2019.
Just to be clear regression can go both ways. It can be both a positive and a negative. The traditional thinking of regression leads people to believe it can only be a negative word, suggesting a player will get worse. However, we can also consider improvement back towards the middle as regression. For example, a player with a TD% of 1.5 can regress back towards their career average of 5.5%.
What is the TD% index?
A statistic which is very useful to use for this is the TD% index or TD%+. For those of you familiar with baseball you may be familiar with numbers similar to this, such as ERA+ or wRC+. What these index numbers do is they put the performances into context. Let’s take Patrick Mahomes for example. He had a TD% of 8.6%, but what does that mean in context to the rest of the league? That is where TD%+ comes in. TD%+ grades players in context to the league average, with a score of 100 being average. Anything above that is good and anything below it is bad.
TD%+ is calculated using a rolling three-year average of performance in the NFL. The average TD% for the three years is calculated and that players performance is then put into context based on how far away they are from that average. The only time this differs is the 2018 season, which is based on the numbers from 2017 and 2018 only. Once 2019 has been completed those numbers will adjust based on the numbers produced in 2019. This allows the performance of a player to be put into the context of that era of the NFL, and allow us to compare performances currently to historical numbers. For more information on TD%+ and how it is calculated. check out this page at Pro Football Reference. However, let’s now look at last season and who are regression candidates in 2019.
Patrick Mahomes, KC | TD%+: 144
For all intents and purposes, Mahomes was a rookie last season. In name, he was not, but in terms of experience on the field he was a rookie, and that is what makes his 50 touchdown season all the more impressive. When you put those touchdowns in percentage context his 8.6 TD% is even more impressive, but matching it in 2019 will be tough.
We have all heard of the sophomore slump. Once the league has had time to watch the tape and adjust to a player they can make plans to stop him. It was not that long ago that many people felt Colin Kapernick could not be stopped. However, defenses adjusted and he was stopped from tearing up the leagues. Mahomes is a better player than Kaepernick, but still, the league will adjust this season. It may not be straight away, but teams will work out how to confuse Mahomes and force him into mistakes.
What does the history say?
History is not on the side of Mahomes either. Nobody since 2,000 has finished with a TD%+ above 140 two years in a row. Peyton Manning had a 168 ranking in 2004, but could only manage 124 the following season, and would only top 140 once more in his career. In 2007 Brady was up at 153, dropping to 110 in his next full year. He has not topped 140 since. Even Aaron Rodgers, who was at 153 in 2011 dropped to 130 the following season.
In fact, Rodgers is the only person since the turn of the century to repeat as the leader in TD%+. That tells you that Mahomes can still be extremely good this season without scaling the same heights. However, it also tells you how difficult it is to be that good, that quarterbacks of the quality of Brady, Manning, and Rodgers have struggled to maintain that standard of play in consecutive years.
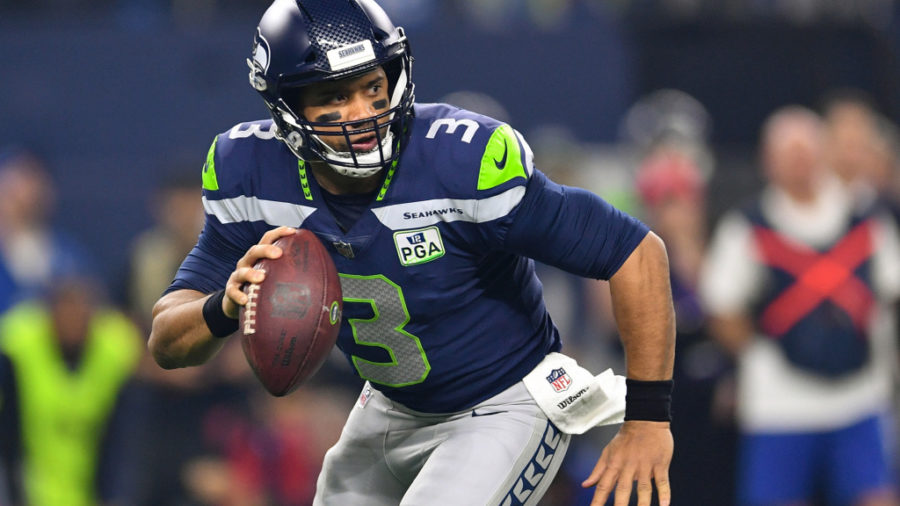
Russell Wilson, SEA | TD%+: 139
No quarterback in the NFL screams regression more to me that Wilson this season. Wilson’s numbers last year were incredible. Despite throwing the least amount of passes of the last five years of his career he ended up with his highest ever number of touchdowns, 35.
Wilson’s TD% was second only to that of Mahomes at 8.2%, 1.3% ahead of third place Ryan Fitzpatrick. It was also the highest of Wilson’s career by 1.2%, when he jointly led the league in TD% with Cam Newton in 2015. Over his career, prior to this season his TD% had fluctuated between 3.8-and-7%.
I am not expecting massive regression compared to the league average as Wilson has finished with a TD%+ of 119 or greater in five of his seven seasons. However, on a run heavy offense expecting him to throw a touchdown on over 8% of his passes is unrealistic. Look for that number to end up closer to 6.5-to-7 in 2019, which is still good, but might leave the Seahawks struggling for a playoff spot in 2019.
Aaron Rodgers, GB | TD%+: 97
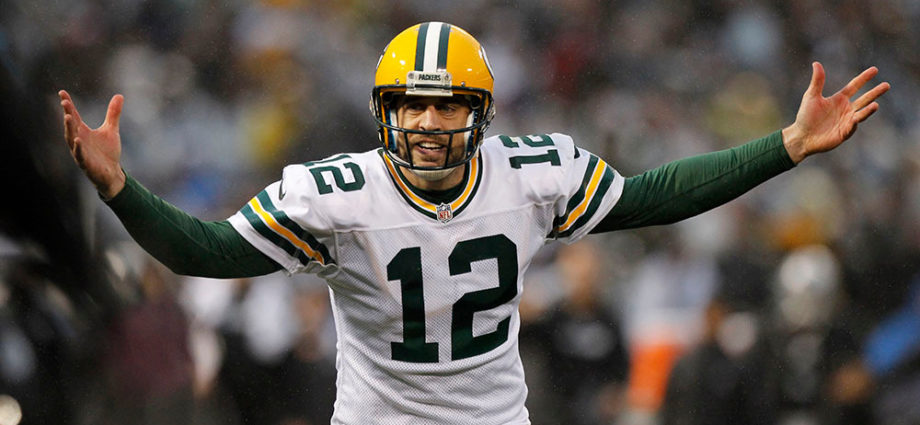
Now we are into the positive regression candidates. On the surface, a TD%+ of 97 does not seem that bad, but in the context of Rodgers career, it is not good. 97 is by far the lowest score that Rodgers has achieved in his career, with his previous low being 112 in 2015.
Previously in seasons where Rodgers has played either 15-or-16 games, he has never had less than 28 career touchdowns. His TD%+ has sat right around the 120 mark for his entire career and I fully expect to see him get back there in the new system under Matt LaFleur.
Things will not be simple, but things cannot really be much worse than last year. He will need help from his offense, as he also had a completion%+ below 100 for just the second time in his career. A lot was made of Rodgers propensity to throw the ball away last year. All of that factors into these numbers and Rodgers needs his offensive weapons to get open more this season. If I was going to bet on this I would absolutely be looking at Rodgers to improve his numbers in 2019.
Derek Carr, OAK | TD%+: 89
It was such an ugly season in Oakland in 2018, and that showed in the numbers for Derek Carr this season. Carr had the lowest TD% of his career last season, with the number reaching 3.4%. Part of that can be attributed to a new offensive system, especially given that Jon Gruden tends to operate the run-first offense.
In fact, when you look at the other numbers that Carr put up that is a big part of what these numbers come down to. He was above average in nearly every other index, including completions and interceptions. However, there were issues in the way Carr performed. Part of that comes to his offensive line, as Carr had the lowest Sack%+ of his career at just 87. That led him to play conservative and throw short quick passes, which have helped to lead to this low TD%.
He also lacked a serious weapon he could trust after Amari Cooper was traded to the Dallas Cowboys. Now with Antonio Brown and Tyrell Williams on the outside, he will have deep threats he can trust to distribute the ball too. The Raiders also invested in their offensive line, which should make Carr feel more secure. This season should be completely different for Carr, and hopefully, that TD% increases.
JOSH ALLEN, BUF | TD%+: 86
Now things get a little bit more interesting. Allen struggled passing the ball last season, but that will have surprised no one. The biggest knock on Allen coming into the league was accuracy. However, after he demonstrated his ability to run the ball defenders will need to treat his legs more seriously. Hopefully, he can use that to his advantage in the passing game.
Allen had a completion percentage of just 52.8 to go with this TD%. Those two numbers combined mean we may not see much improvement this season. Throw in an interception percentage which was higher than his TD%, and things are really ugly. In this situation I am banking on improvement from Allen, but I certainly would not be betting on it.

Image credits:
Dennis Wierzbicki-USA TODAY Sports
Shane Roper-USA TODAY Sports
Cary Edmondson-USA TODAY Sports